LOUIS acoustic
Back to home
Technology & Documents

Technical Documents

The simulation and measurement tools LOUIS ACOUSTIC actually uses, our design drawings, and commissioning data.

Ray-tracing visualization — ODEON method · energy decays per reflection
Official ODEON introduction — Room Acoustics SimulationLOUIS ACOUSTIC designs with a licensed copy of ODEON.
Engineering Documents

Every projectstarts on paper.

Actual design drawings and speaker-placement calculations from our projects. We define rooms in dimensions, loads and coordinates — not by feel. Key structural specifications are blurred for confidentiality.
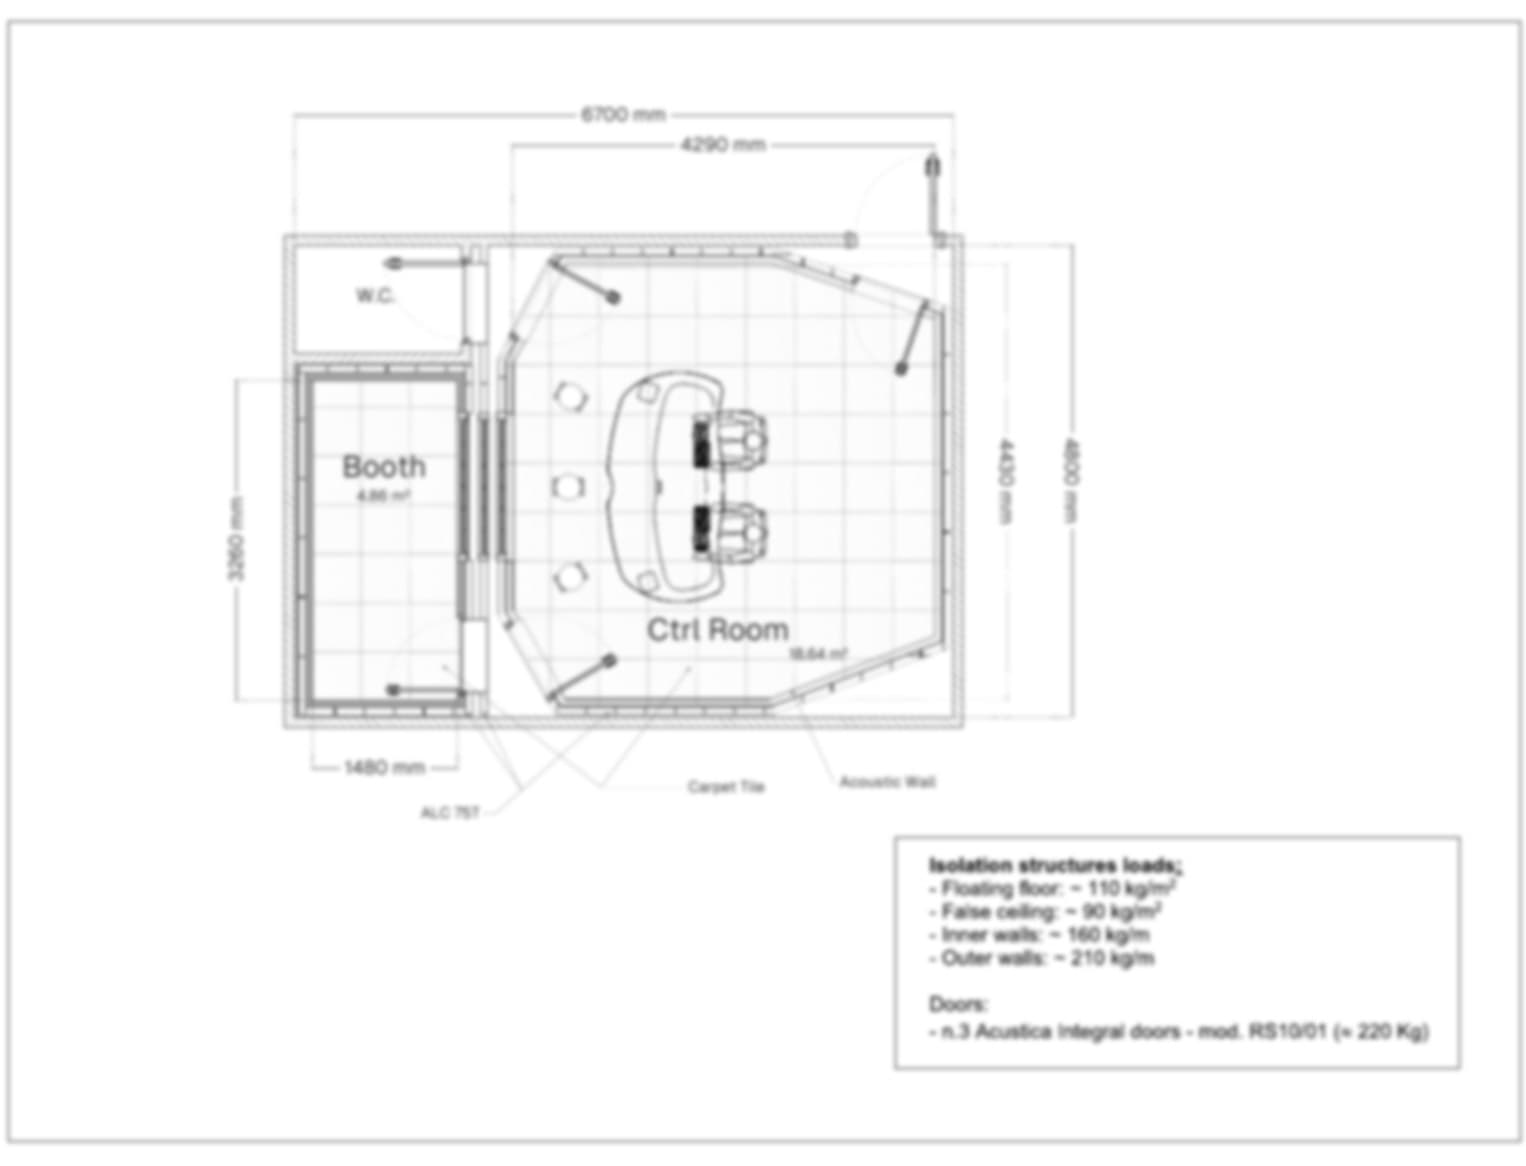
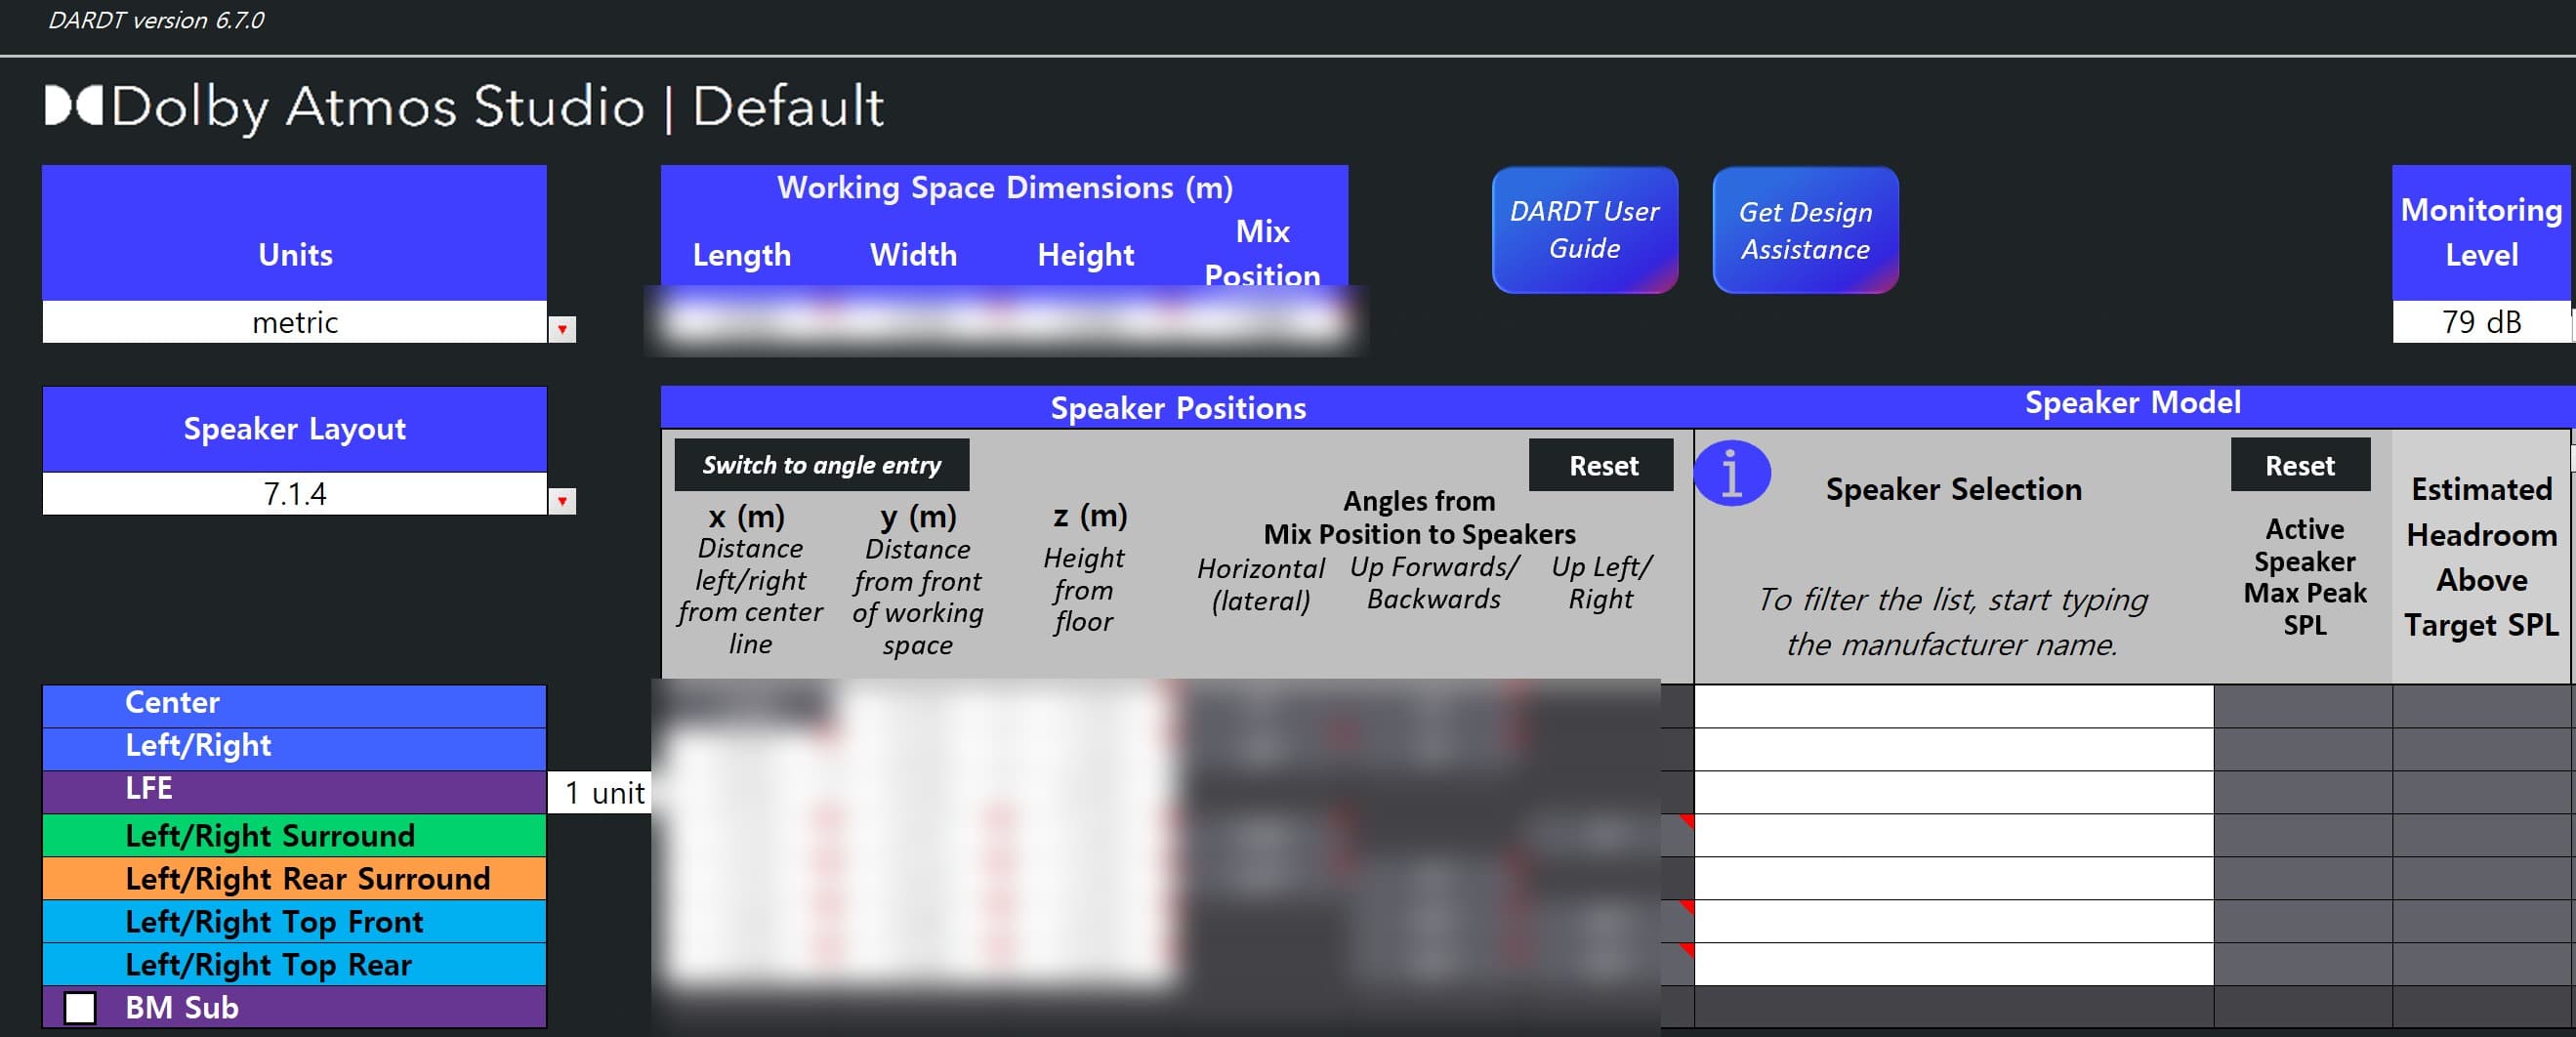
FIG. 01·Studio control room & booth planPLAN · REDACTED
Studio control room & booth plan
Construction drawing covering room-in-room isolation, acoustic doors, absorption and diffusion. Wall build-ups and load specifications are redacted as proprietary know-how.
FIG. 02·Dolby Atmos 7.1.4 design sheetDOLBY ATMOS ROOM DESIGN
Dolby Atmos 7.1.4 design sheet
An actual design sheet from the Dolby Atmos Room Design Tool — working-space dimensions, mix position, and per-speaker coordinates (x·y·z) and angles.
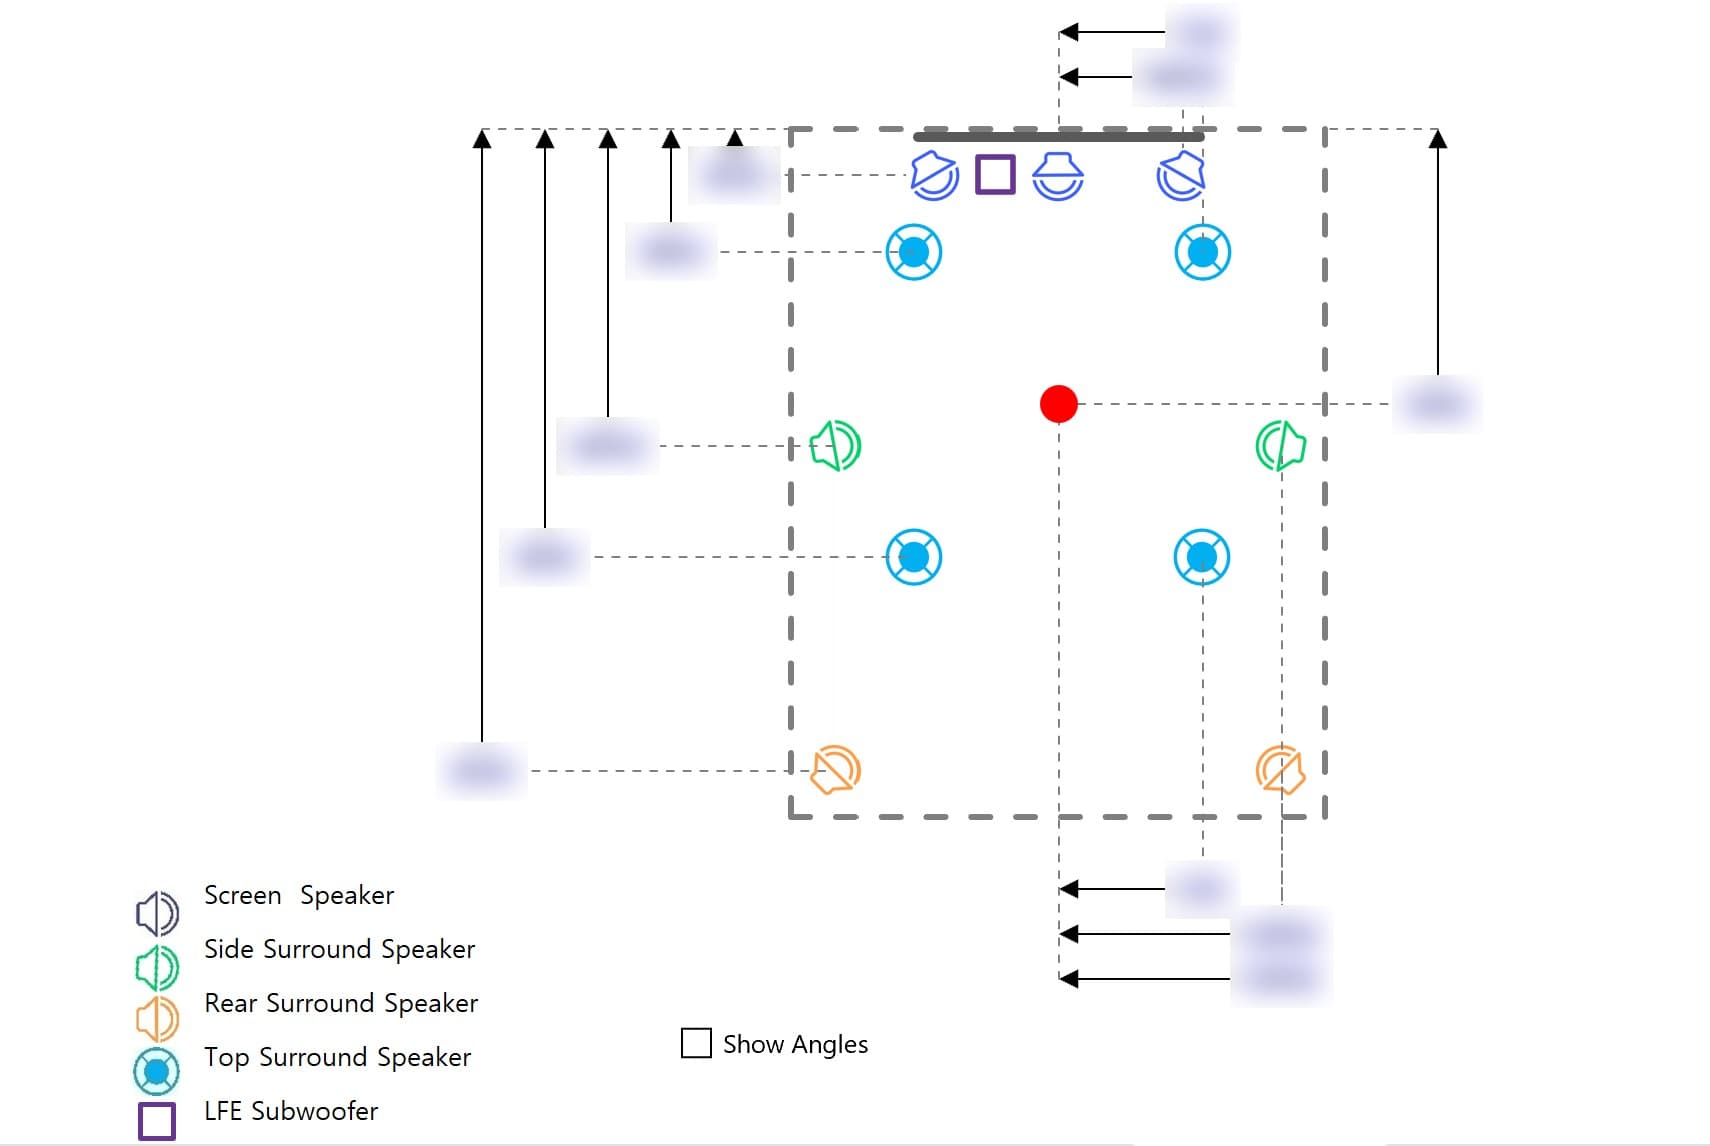
FIG. 03·Speaker layout — planPLAN VIEW
Speaker layout — plan
7.1.4 speaker layout in plan — screen, surround, top speakers and LFE positioned by millimetre coordinates.
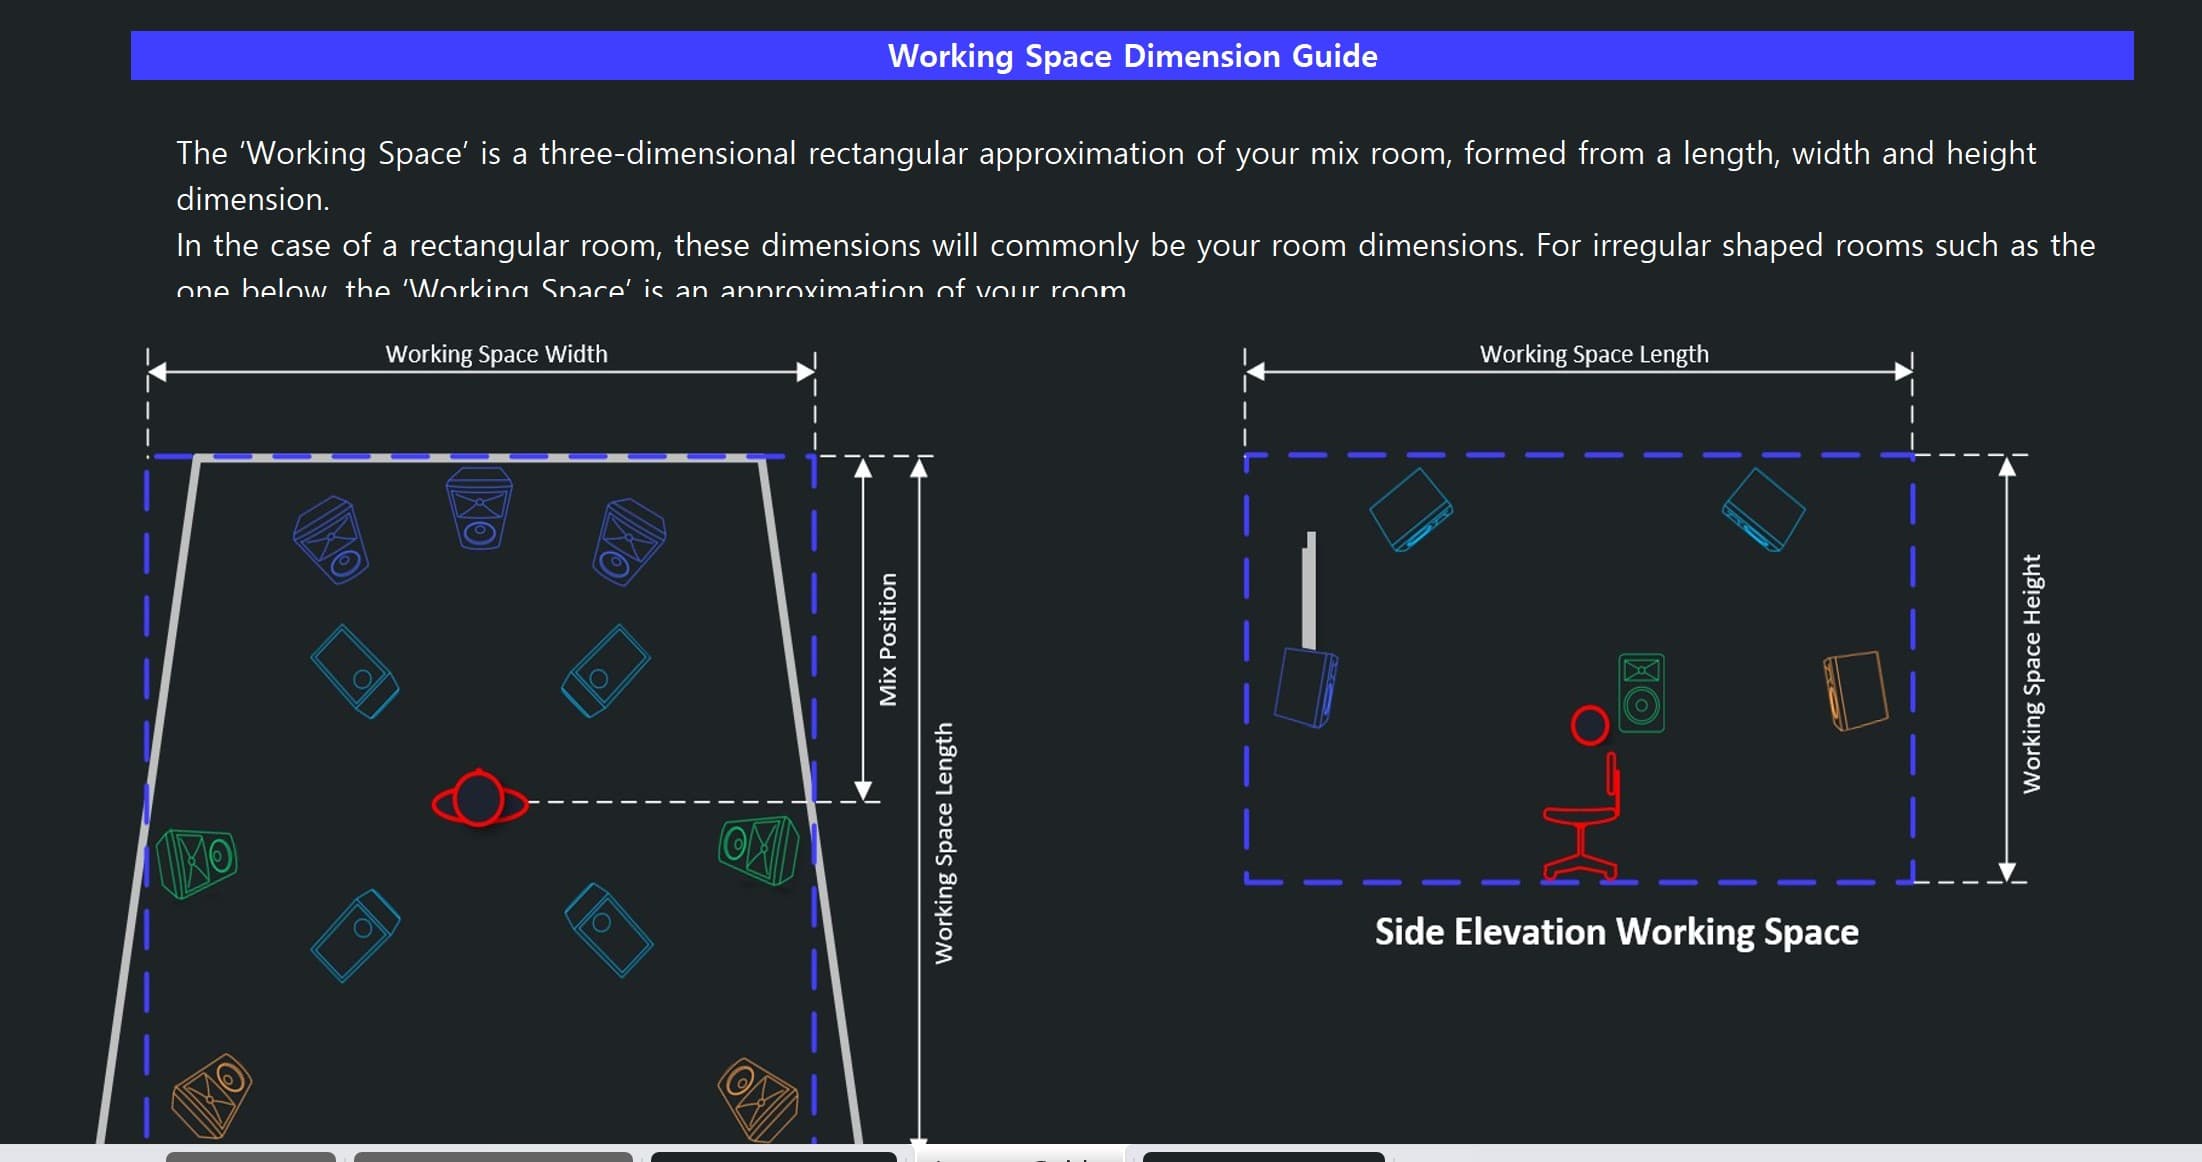
FIG. 04·Defining the working spaceWORKING SPACE
Defining the working space
The three-dimensional working-space approximation of a mix room — length, width, height and mix position.
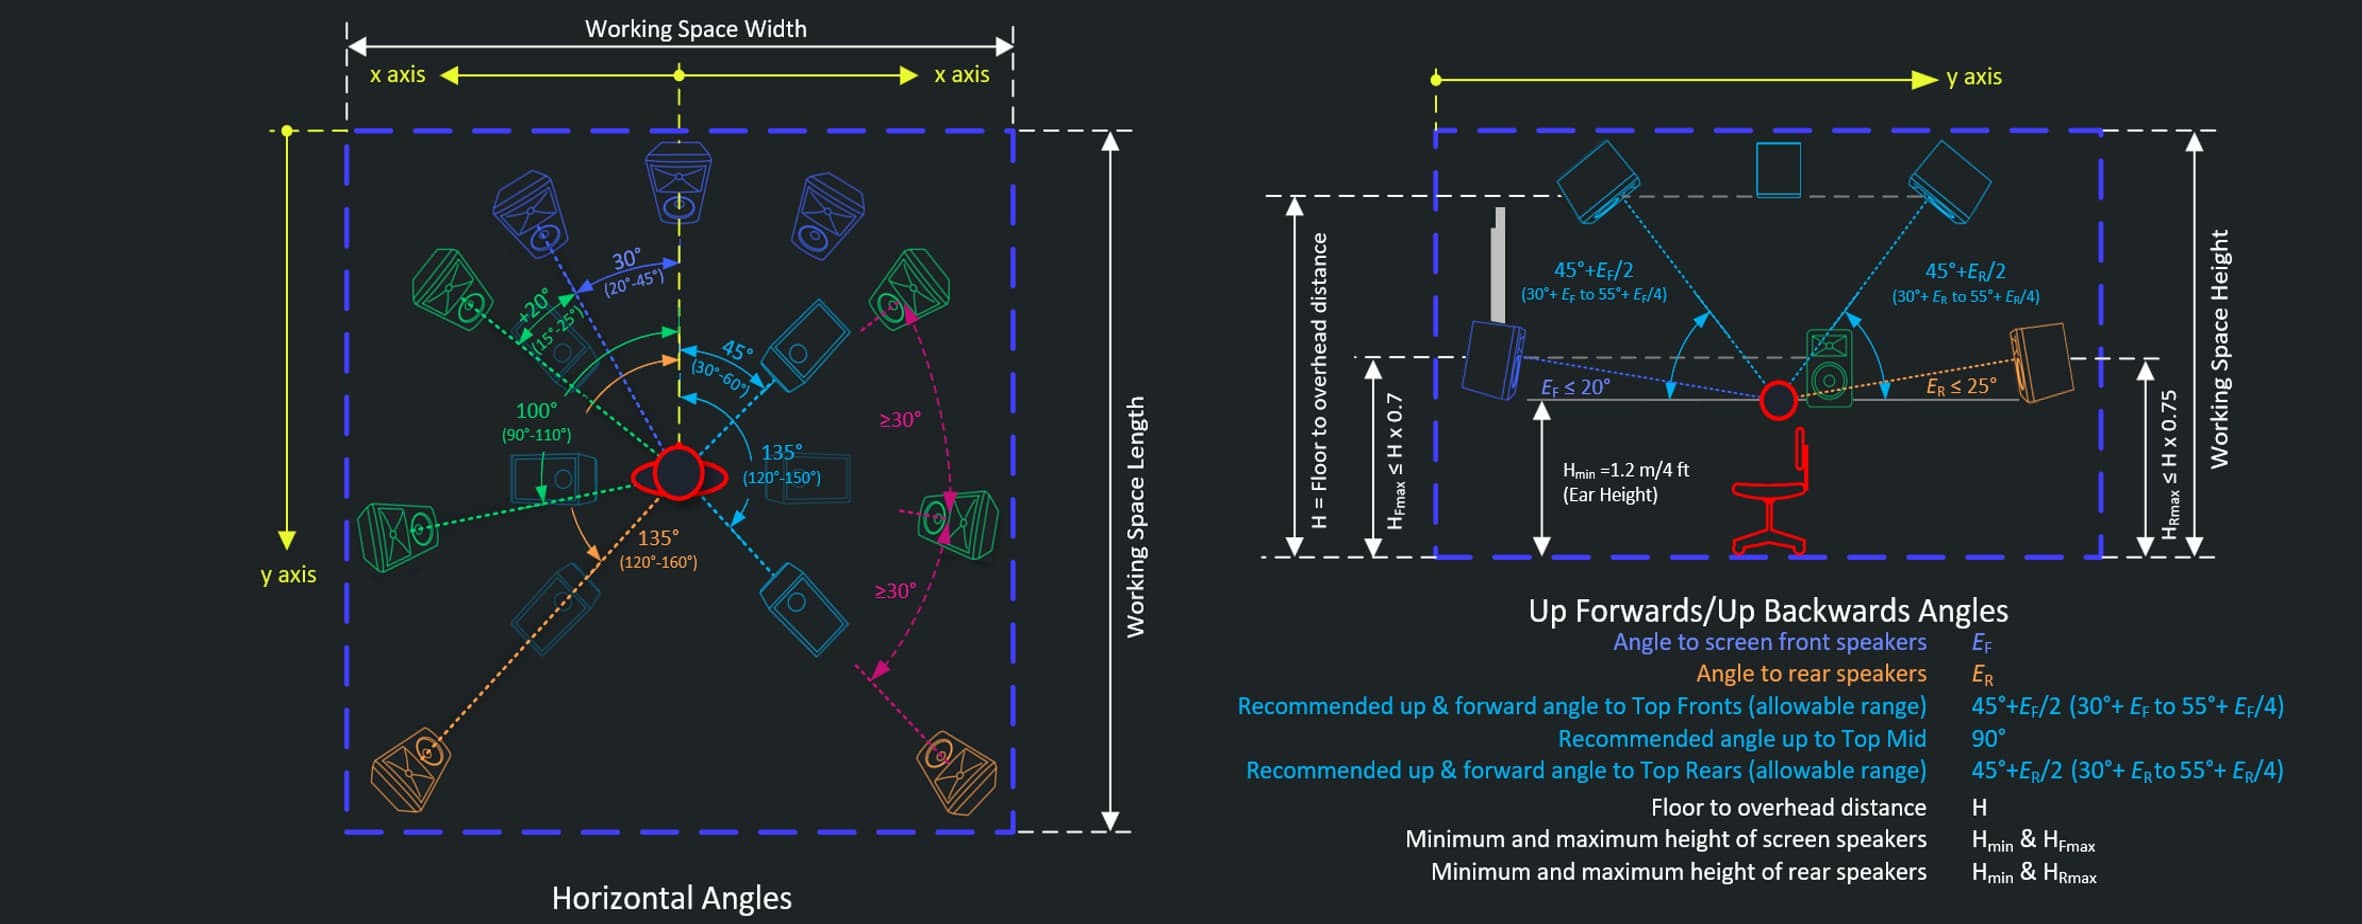
FIG. 05·Speaker angle criteriaANGLE CRITERIA
Speaker angle criteria
Allowable horizontal and elevation angle ranges for top-front and top-rear speakers, calculated to Dolby criteria for each room.
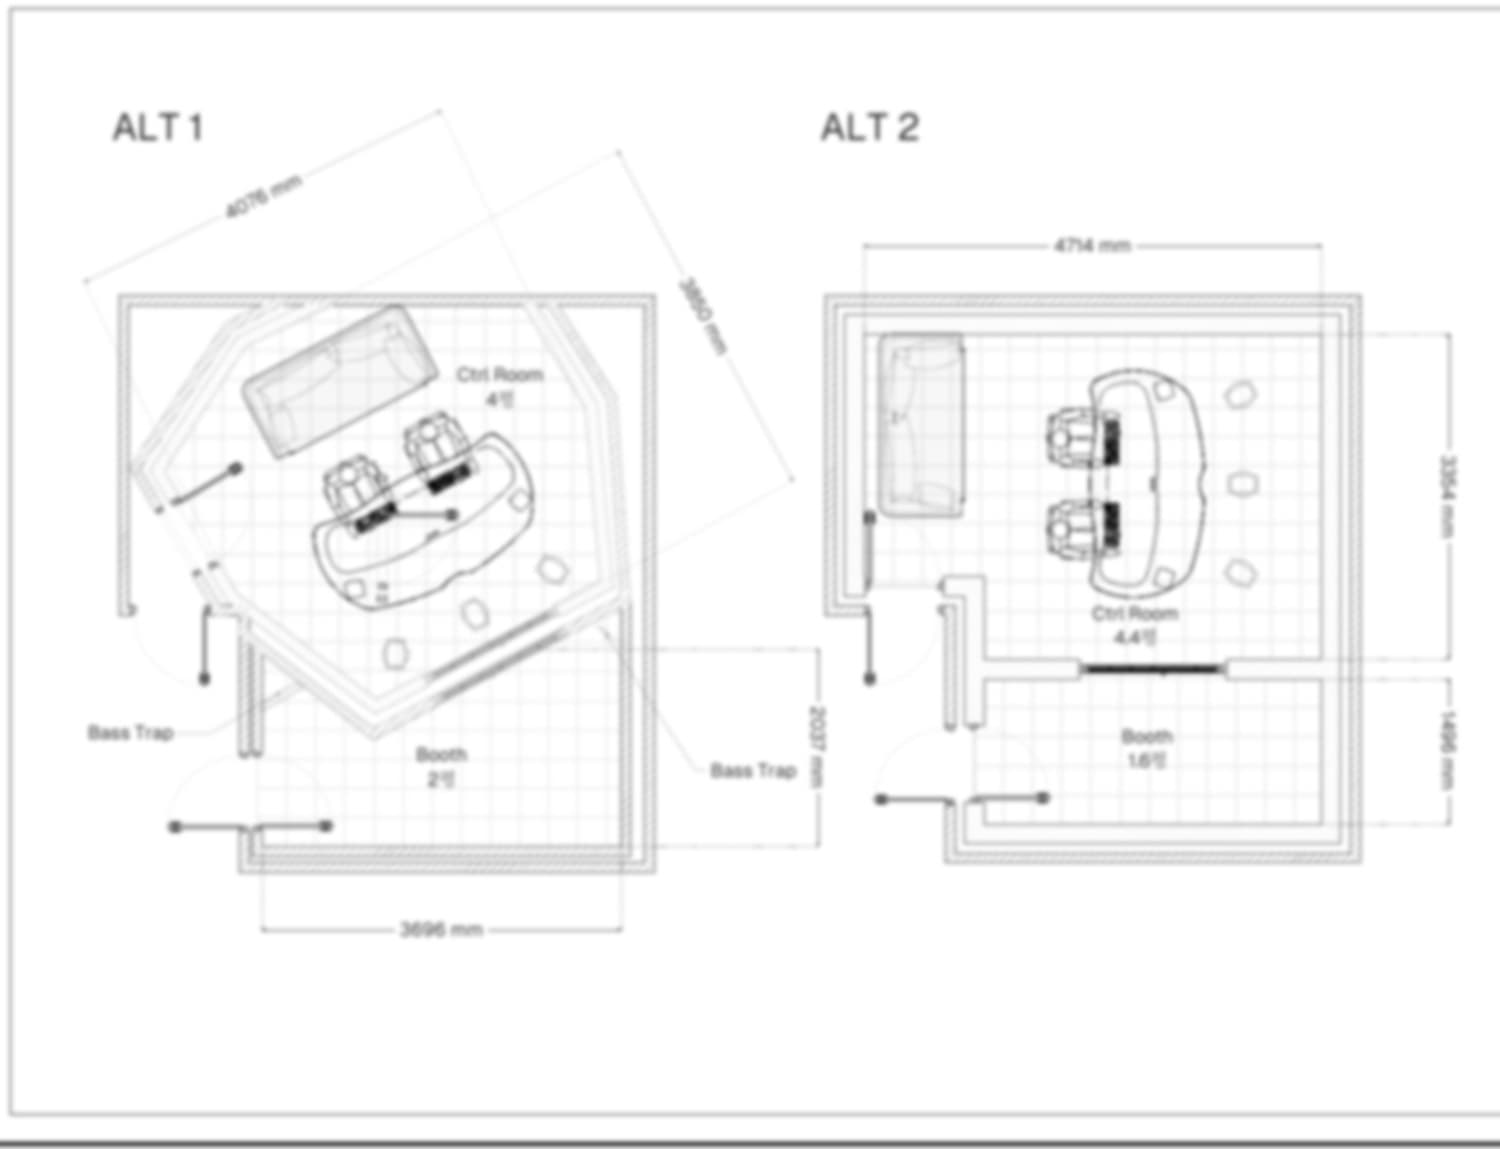
FIG. 06·Design alternatives — ALT 1 / ALT 2DESIGN ALTERNATIVES · REDACTED
Design alternatives — ALT 1 / ALT 2
Two layout options for the same space — room geometry, bass-trap positions and booth configuration compared to propose the optimum.
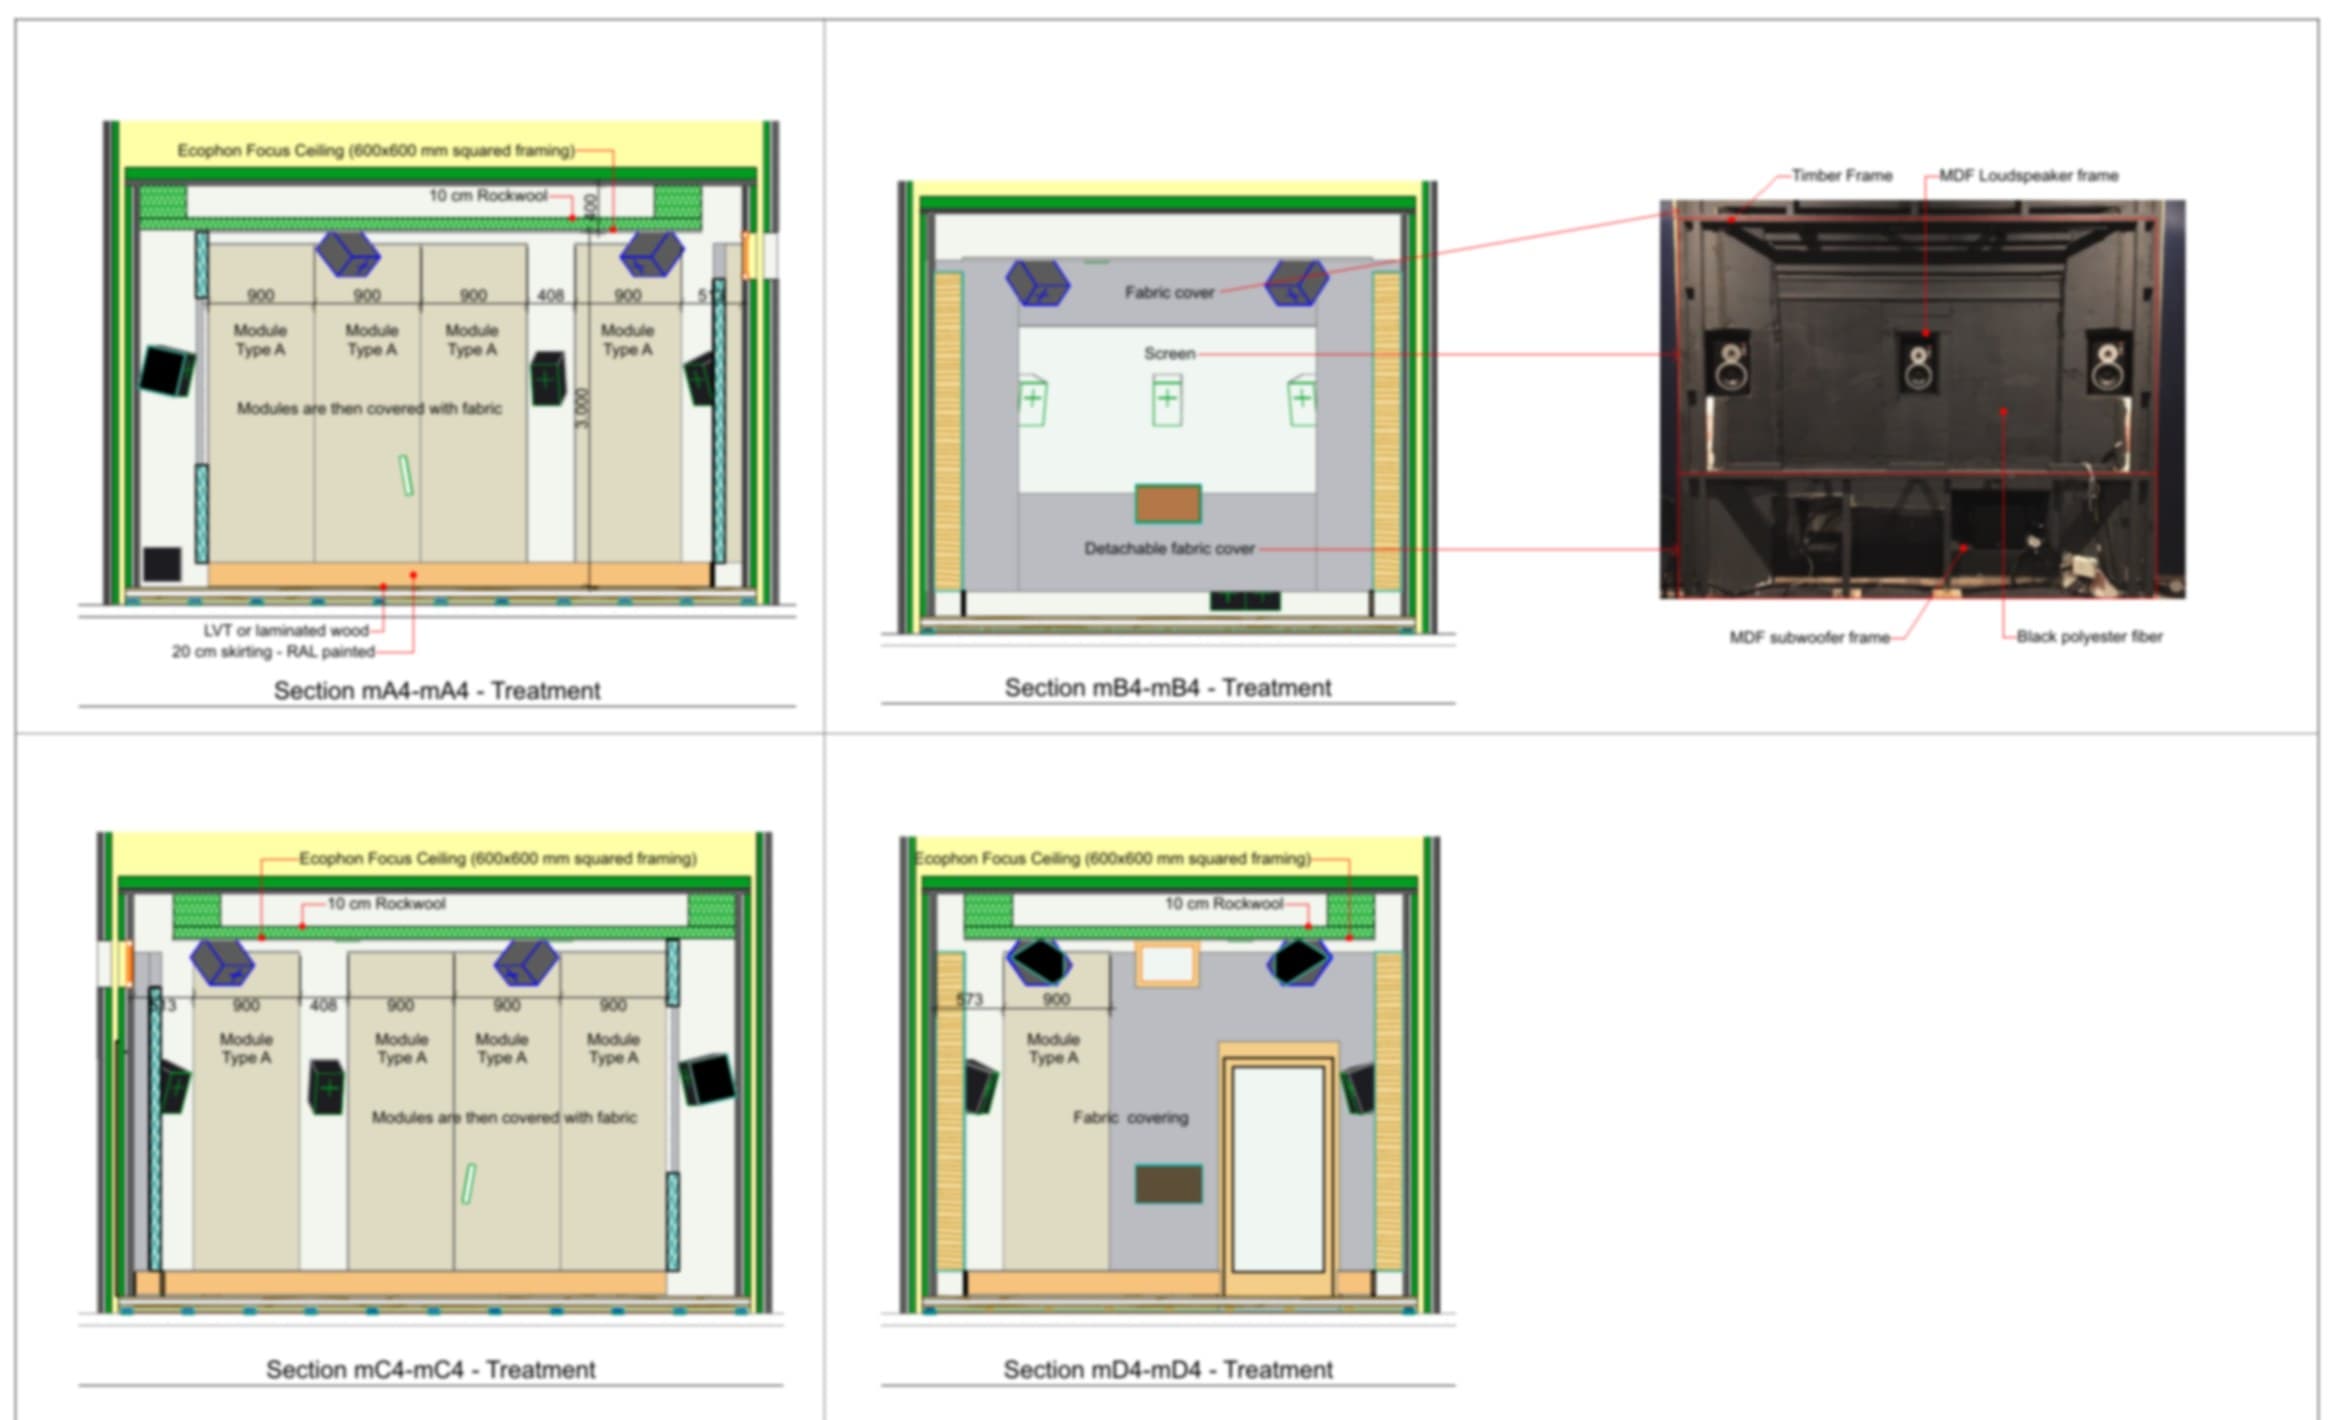
FIG. 07·Mix room wall sections · ceiling detailWALL SECTIONS · CEILING
Mix room wall sections · ceiling detail
Vertical wall sections and ceiling treatment from an international studio project — absorber module build-up, ceiling absorption layer and finishes.
Measured, Not Promised

We prove itwith measurements.

Every project is delivered with a performance report. These are the key metrics we engineer, and representative measurement plots.

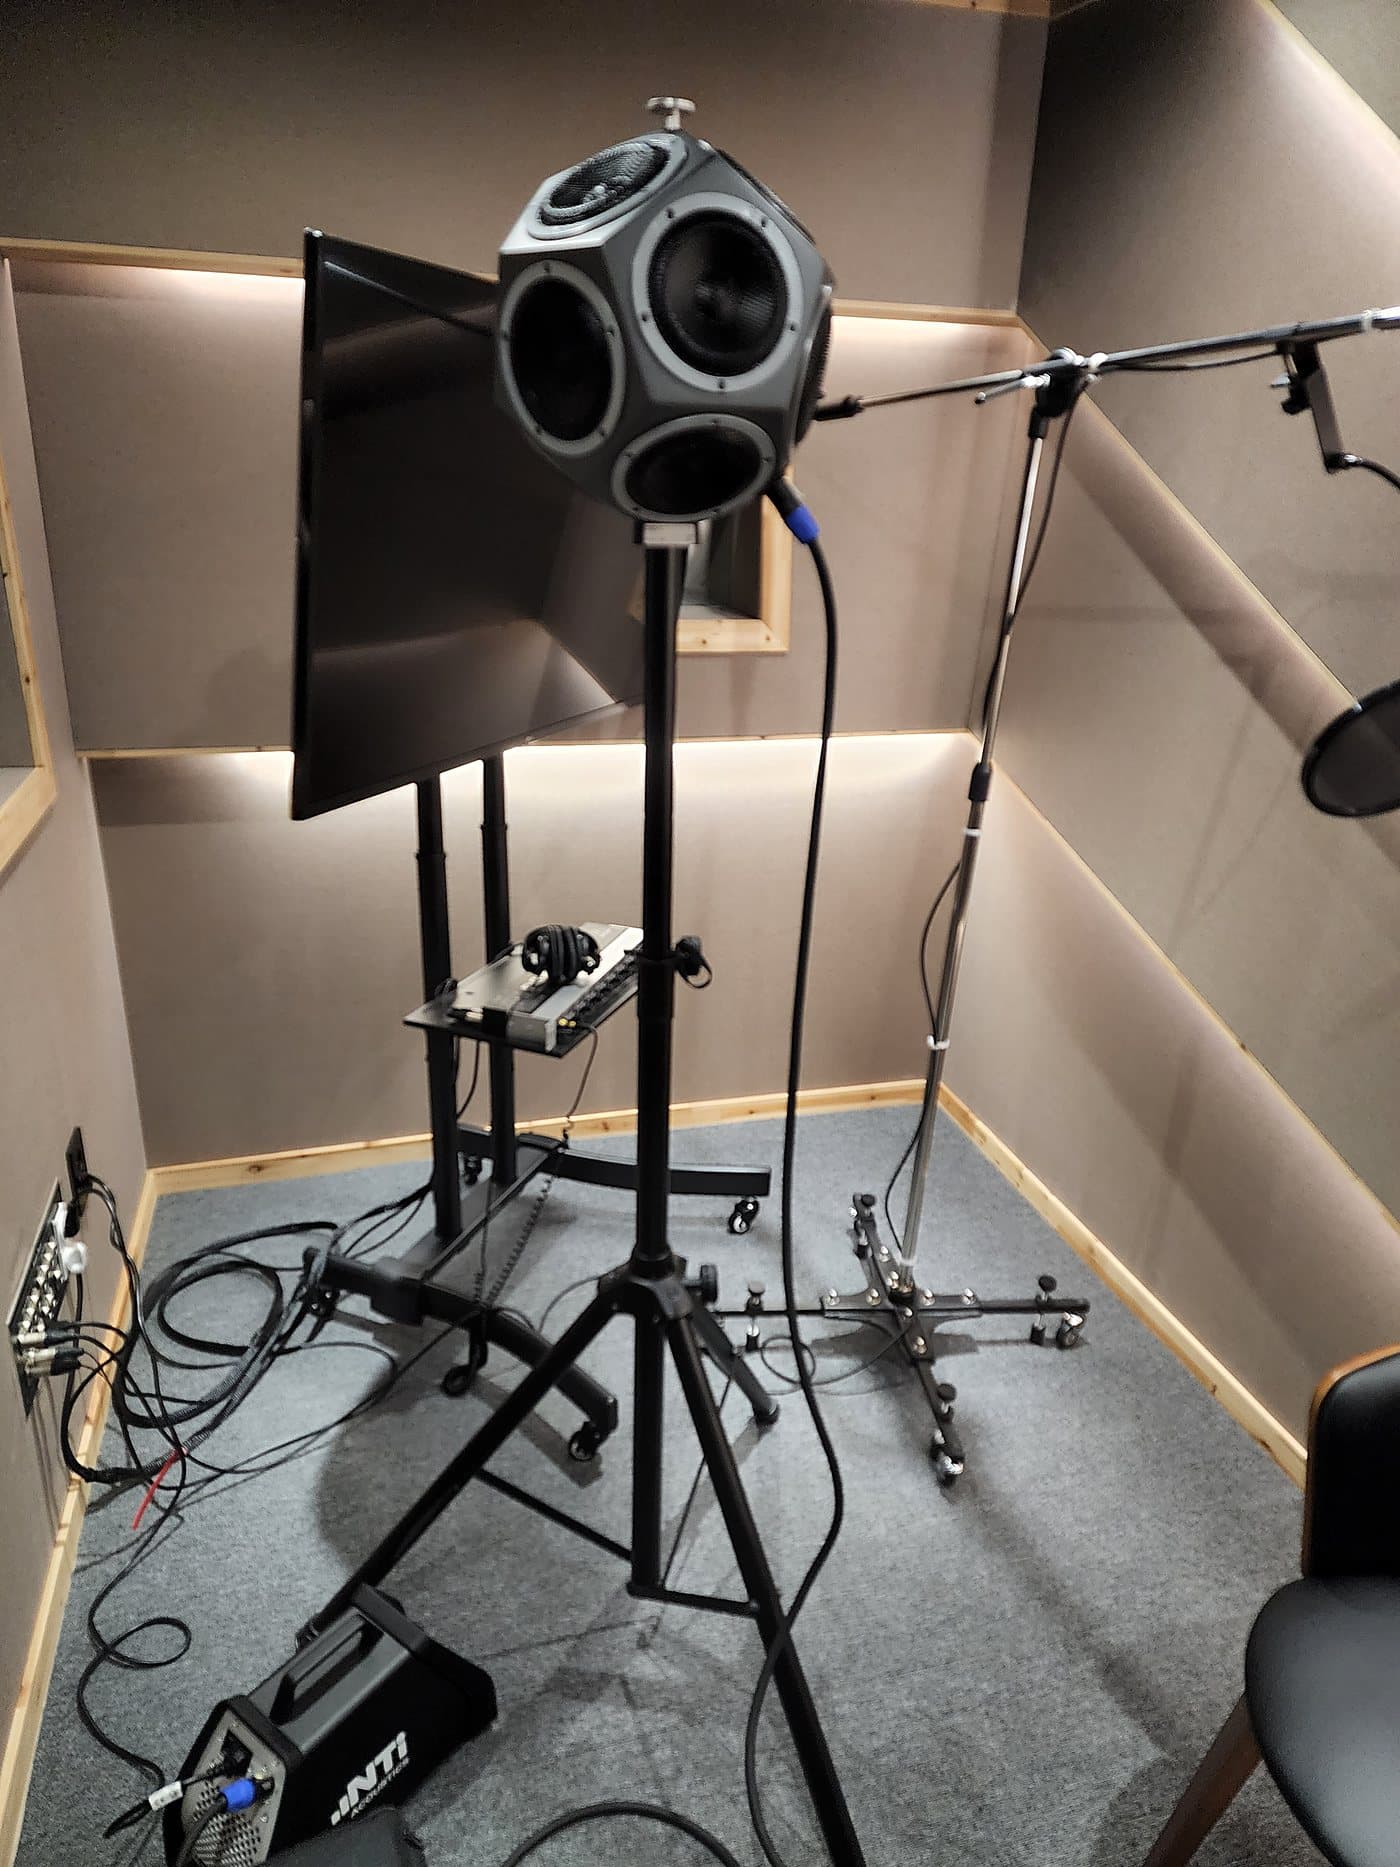
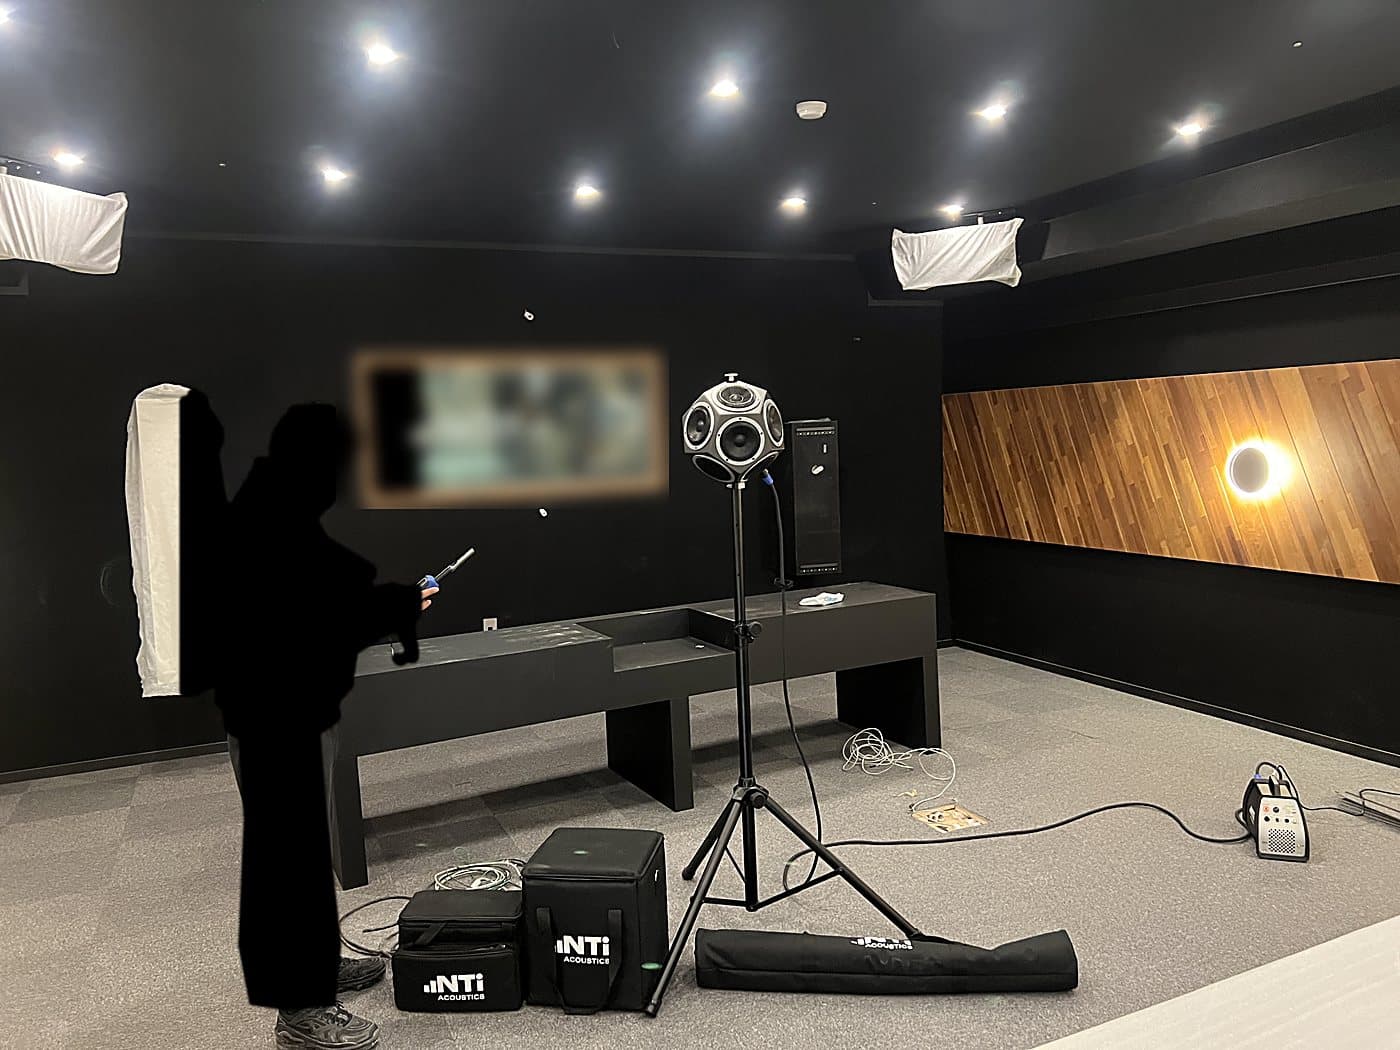
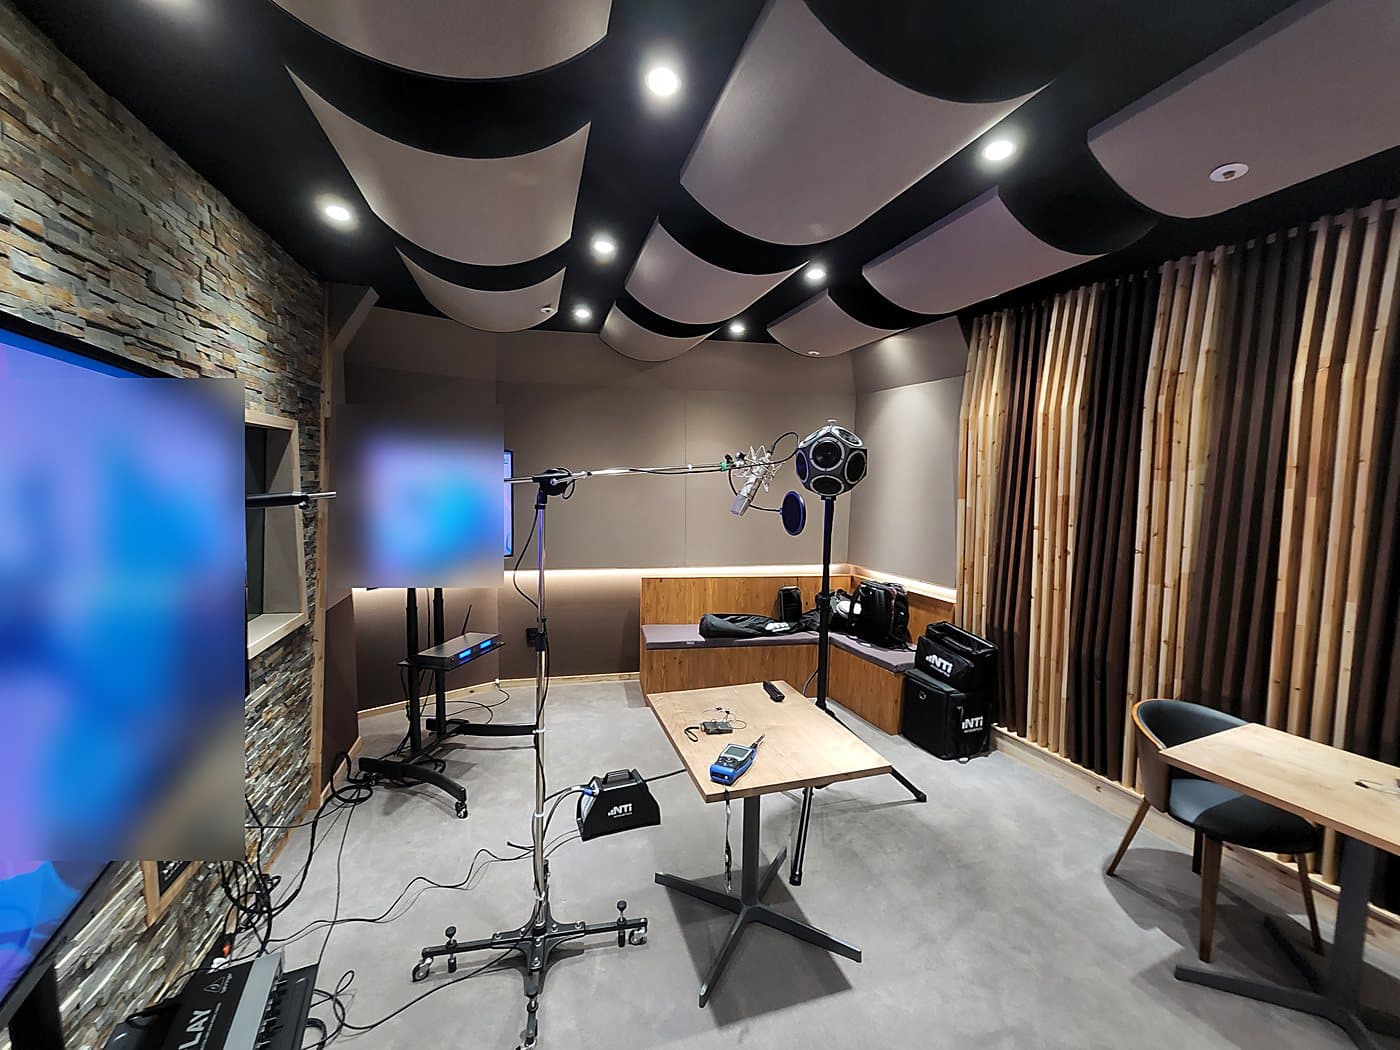
RT60(T30) Reverberation — ADR booth · commissioning measurement
NTi XL2 SNo. A2A-14364-E0 · M2230 SNo. 7557 · 2022-08-18 · ISO 3382
0.1
0.2
0.3
0.4
125
0.27
250
0.15
500
0.15
1k
0.10
2k
0.09
4k
0.10
8k
0.10
Target ≤ 0.25 sMeasured · Hz / s
Noise criteria — same project · commissioning measurement
ANSI/ASA S12.2-2008 · LZeq octave bands · 2022-08-18
NC-19
Ultra-low noise floor, studio grade
631252505001k2k4k8k
Hz / dB LZeq

Measured at the time with the NTi XL2 + M2230; we now operate its successor, the XL3.

RT60

Reverberation Time

Time for sound to decay 60 dB. Designed and verified per room purpose.

FR

Frequency Response

Flat reproduction from lows to highs — the basis of accurate monitoring.

IR

Impulse Response

The time structure of reflections, used to control early reflections.

STI

Speech Transmission Index

Speech intelligibility from 0 to 1. Key metric for meeting and lecture rooms.

NC

Noise Criteria

Rating of HVAC and external noise. Studios target NC-20 or below.

STC

Sound Transmission Class

Isolation performance of walls, doors and windows — verified by measurement.

C50

Speech Clarity

Energy ratio within 50 ms — how clearly speech is heard.

C80

Music Clarity

Clarity at 80 ms — the balance metric for halls and music rooms.